PTP Track Hound is a free software, that allows you to easily record, visualize and analyze PTP (IEEE 1588) network traffic. It is the successor of Meinberg PTP Monitor, which will not be the subject of further development. The software is available for Windows, Linux and macOS.
As it is explicitly designed for the special requirements of PTP, PTP Track Hound is a perfect replacement for standard generic capturing tools like Wireshark for everyone, who is interested in learning more about the behaviour of PTP capable devices and the fundamental functionality of PTP.
The main window of PTP Track Hound is seperated into four tiles, which can be individually sized within the main window, detached to be shown in a seperate window, for example on a second screen, or also closed if you do not want to use them.
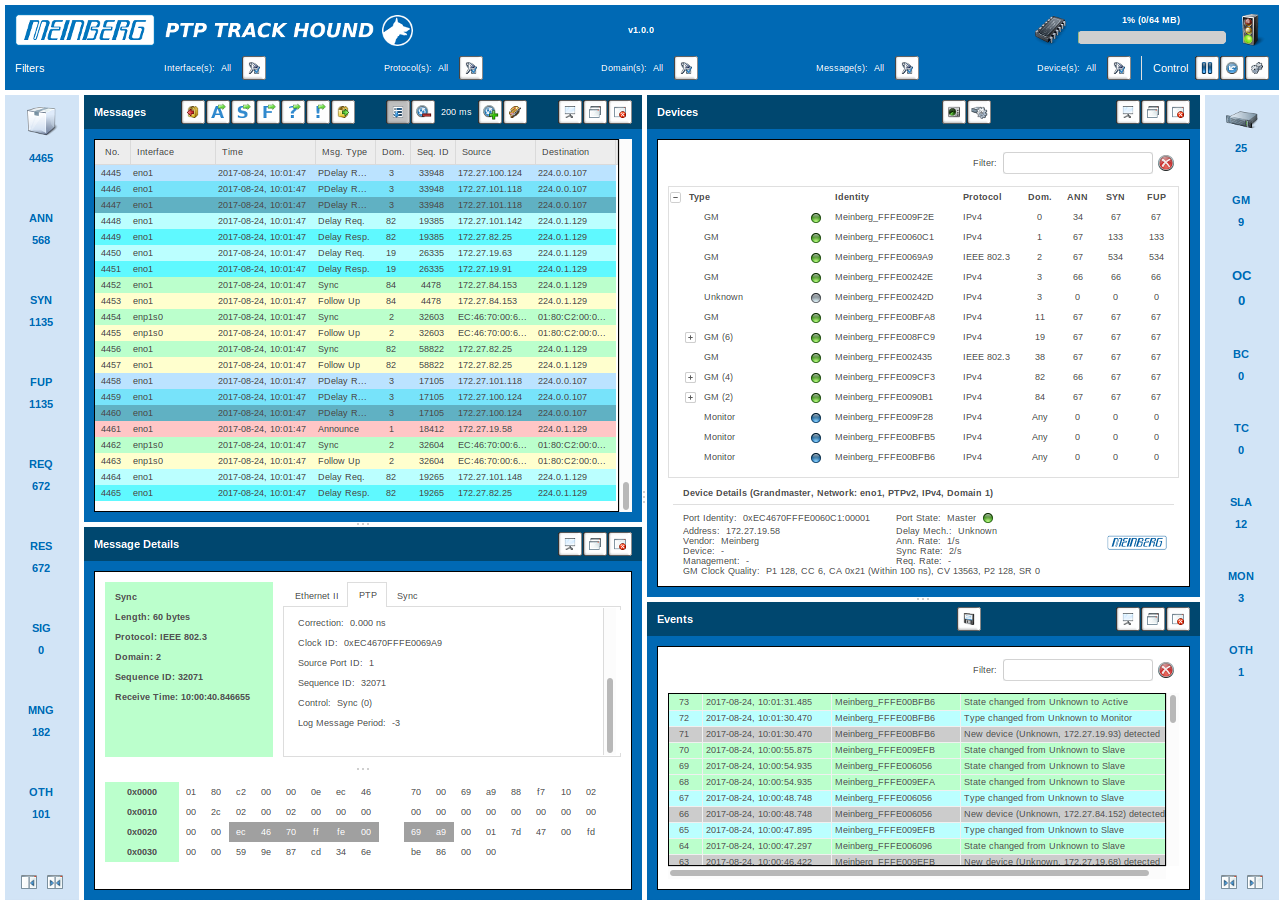
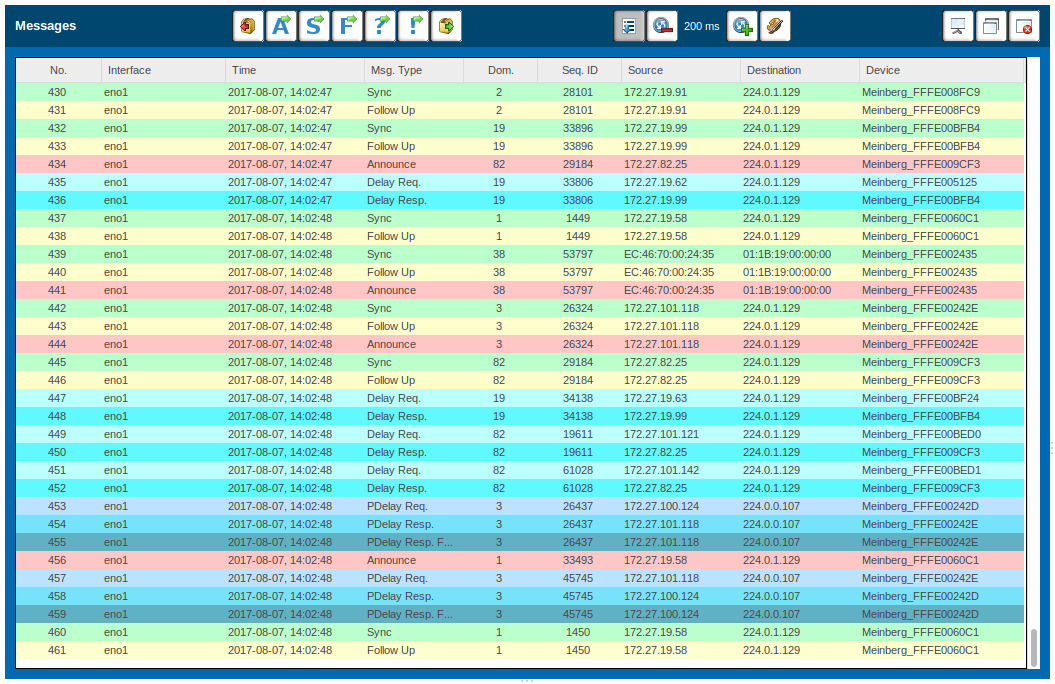
Tile 1: Messages
The "Messages" tile offers an overview of all PTP messages in the network.
It can be filtered by protocol, domain, message type, source device and capture interface.
Different PTP message types are visualized in different colors to allow an instant overview. The colors can be configured by the user. In addition to that, seven buttons at the top right ("A", "S", "F", ...) allow to easily jump between Announce, Sync, Follow Up and other PTP messages.
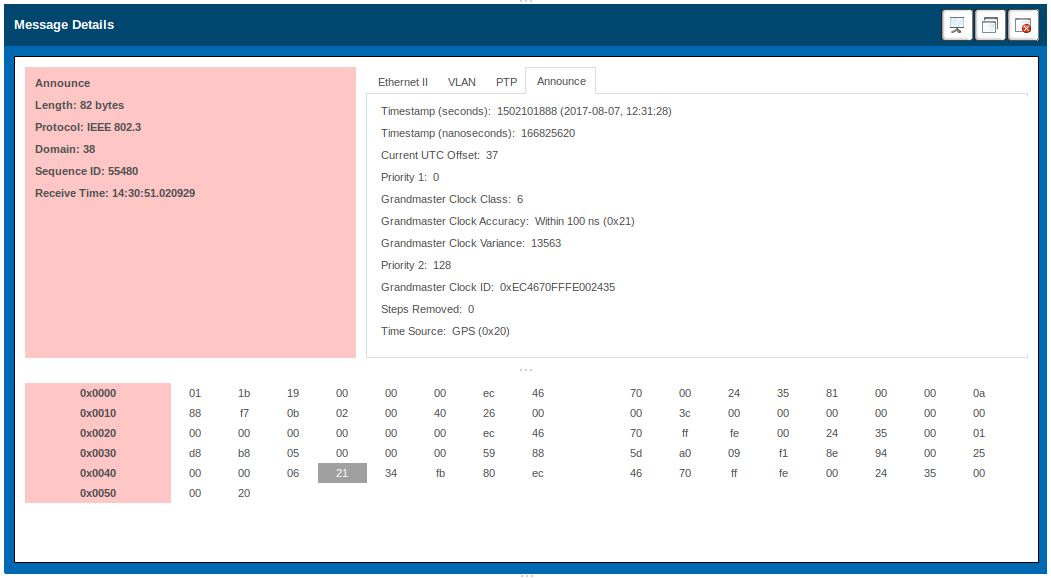
Tile 2: Message Details
The "Message Details" tile allows to analyze PTP messages in detail. It parses raw packet data, decodes all types of PTP messages and TLVs and displays them in human-readable format.
When hovering a parameter in the PTP message, the raw packet data is highlighted at the appropriate position, so that message content can be easily analyzed.
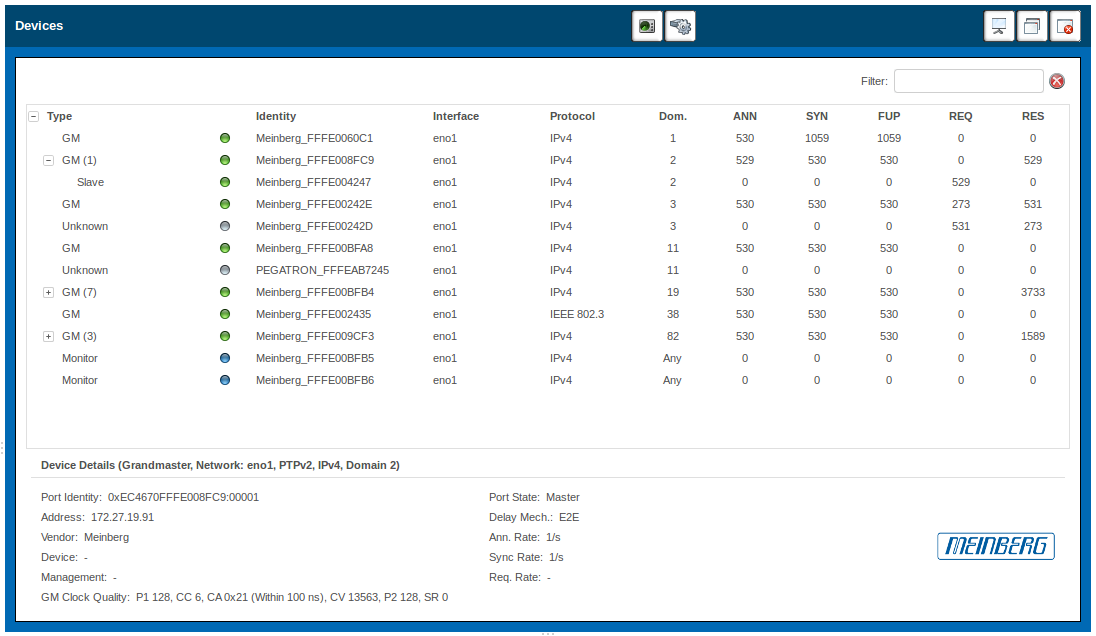
Tile 3: Devices
The "Devices" tile offers an overview of all PTP devices in the network. Slaves, Ordinary Clocks and Boundary Clocks are automatically attributed to their Masters, so that the synchronization hierarchy can be discovered at the first glance.
Detected devices can be given individual names, management addresses and images for easier identification. In addition to that, a detailed overview of the number of PTP messages that have been sent by a device is shown, message rates are calculated and used delay mechanisms are determined.
Besides, configuration issues like diverse Announce message rates or delay mechanisms on different devices are detected and standard violating devices like illegal Masters are identified.
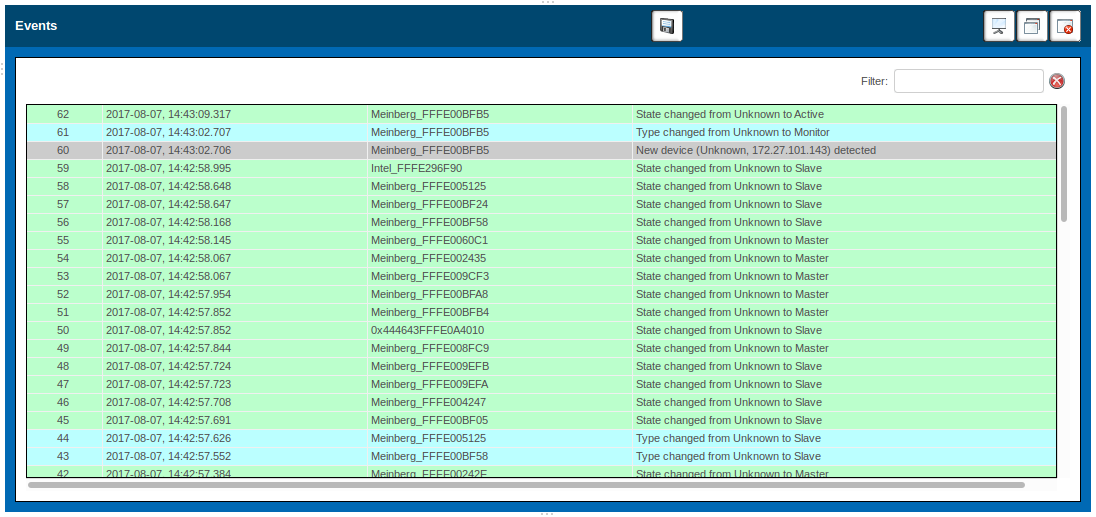
Tile 4: Events
The "Events" tile points out new devices, type and state changes and warns about multiple Masters and other configuration issues. System notifications can be configured and will be generated as soon as the appropriate events occur.
Important user interactions are logged for easier traceability of the application behaviour.